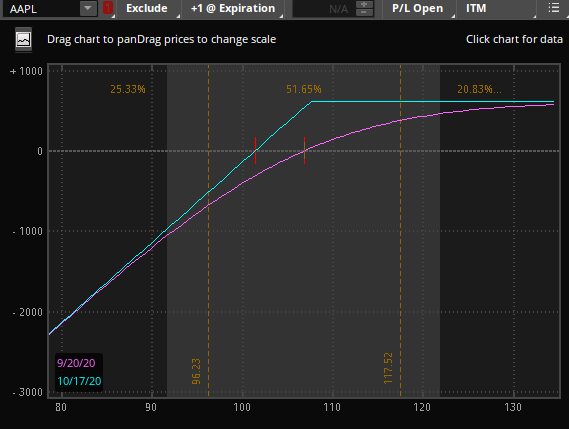
How well do you know your P&L charts? Good enough that you can quickly guess the underlying position(s)? Already know I’m trying to trick you because you paid attention last time I did this? Take a look at the below and guess what it is:

Did you figure it out? It is a Covered call. A trade that people will often start with when learning about options as a stock investor. For some, covered calls is all they do. They buy (or already have) stocks they want to hold for the long term and sell some occasional calls against it, trying to “create their own dividend” or just get a bit more income from time to time.
I have spoken to some investors of this type and asked “Have you considered selling puts?” The look of shock and horror you can get is really entertaining… Let’s take a look at the P&L of the short put:
Look familiar? Go ahead and look at the other P&L diagram again. I’ll wait.
It is the same. Not a coincidence. This is because a covered call and a short put are synthetically the same.
The covered call above is:
- Buy 100 shares AAPL at 106.84
- Sell 1 October 16th 107.5 call for 5.42
The put is:
- Sell 1 October 16th 107.5 put for 6.08
The max profit on the covered call is the price we received for selling the call plus difference in our strike and the purchase price of stock:
- Strike – Purchase + Short_Call = Max Profit
- 107.50 – 106.84 + 5.42 = 6.08
Liar! This can’t be true!
A bit harsh, but it is. You can try it yourself and see. You may be off by a little bit with bid/ask spreads. Before you ask, yes there are other things to consider (like the risk free rate), but let’s keep this at the 101 level.
These positions are equivalent. The fact that the P&L charts are the same should make it clear, but let’s look at the numbers a bit.
Short put
We’re selling a put and that defines our max profit. If we sell it for 6.08, the most we can make is $608. At expiration, if AAPL is below 101.42, we will be negative on the trade, just as if we were long 100 shares. This break even is simply the strike price minus the premium received (107.50 – 6.08 = 101.42)
Covered Call
We’re buying 100 shares and selling a call. The max profit on the covered call is the price we received for selling the call plus difference in our strike and the purchase price of stock:
- Strike – Purchase_Price + Short_Call = Max Profit
- 107.50 – 106.84 + 5.42 = 6.08
As we are long 100 shares, we will lose on the trade if AAPL goes down. We have the call credit to help buffer those losses, so our break even is our Purchase Price minus the Short Call credit:
- Purchase_Price – Short_Call = Break Even
- 106.84 – 5.42 = 101.42
But what about Puts being more expensive than Calls?
The very important distinction here is that we are comparing the Same strike. If you compare an OTM put with an OTM call, you have two different positions and you will, of course, see two different P&Ls. OTM puts in equity Do tend to have higher IVs than OTM calls – this is the traditional equity skew. That’s a topic for another day.
But wait, there’s more!
This is just One of the examples of how you can create equivalent positions with options. There are many more. Search things like “put call parity”, go read Natenberg. Or just ask me.
Want to talk about option synthetics more? Who doesn’t?! Reach out via email, Facebook, or Twitter.
Want to trade options profitably in less than 5 hours a week? Who doesn’t?! (I already used that, sorry again. Really.). Join Option Salary today!